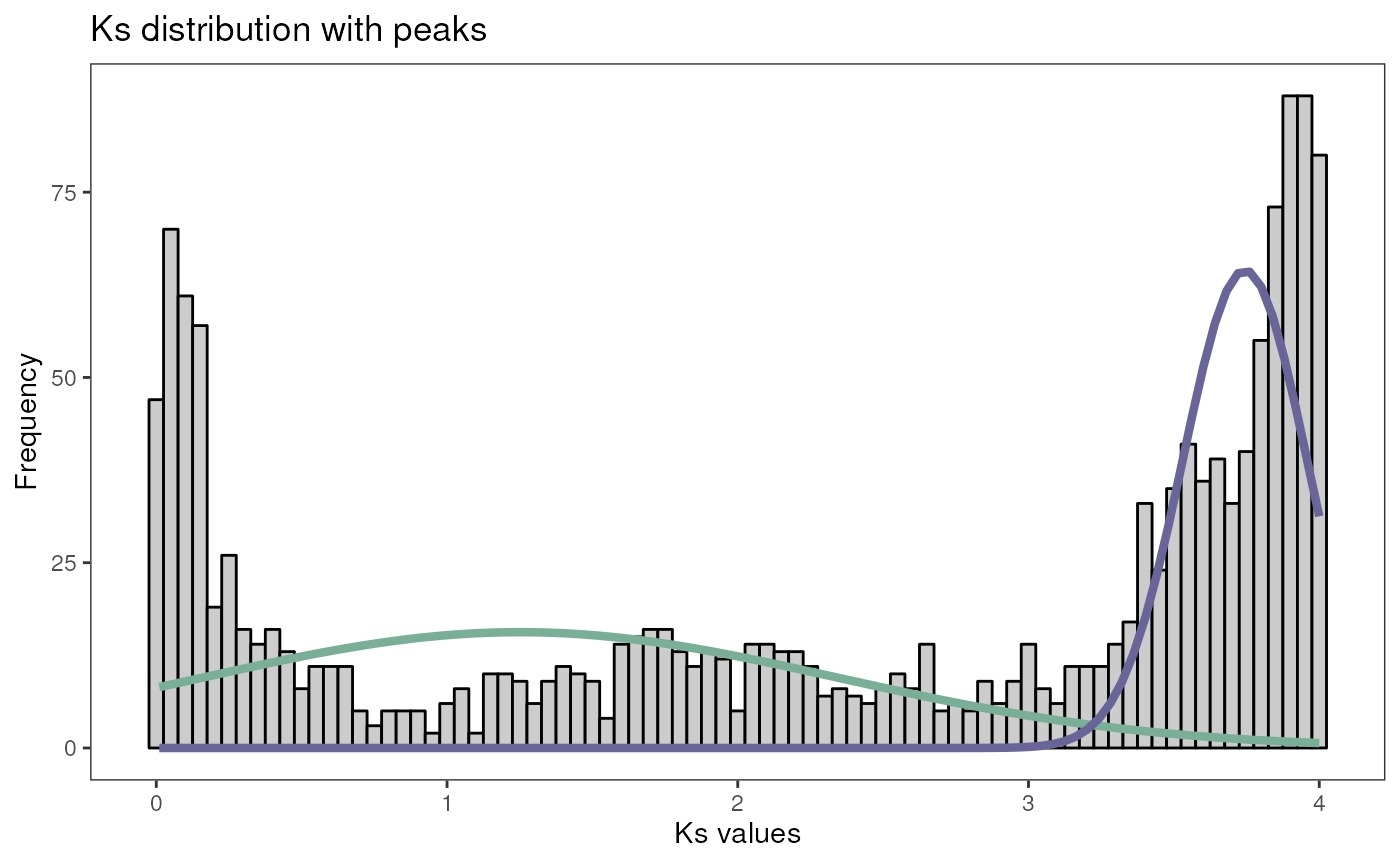
Plot histogram of Ks distribution with peaks
Usage
plot_ks_peaks(peaks = NULL, binwidth = 0.05)
Arguments
- peaks
A list with elements mean, sd,
lambda, and ks, as returned by the
function fins_ks_peaks().
- binwidth
Numeric scalar with binwidth for the histogram.
Default: 0.05.
Value
A ggplot object with a histogram and lines for each Ks peak.
Examples
data(fungi_kaks)
scerevisiae_kaks <- fungi_kaks$saccharomyces_cerevisiae
ks <- scerevisiae_kaks$Ks

# Find 2 peaks in Ks distribution
peaks <- find_ks_peaks(ks, npeaks = 2)

# Plot
plot_ks_peaks(peaks, binwidth = 0.05)