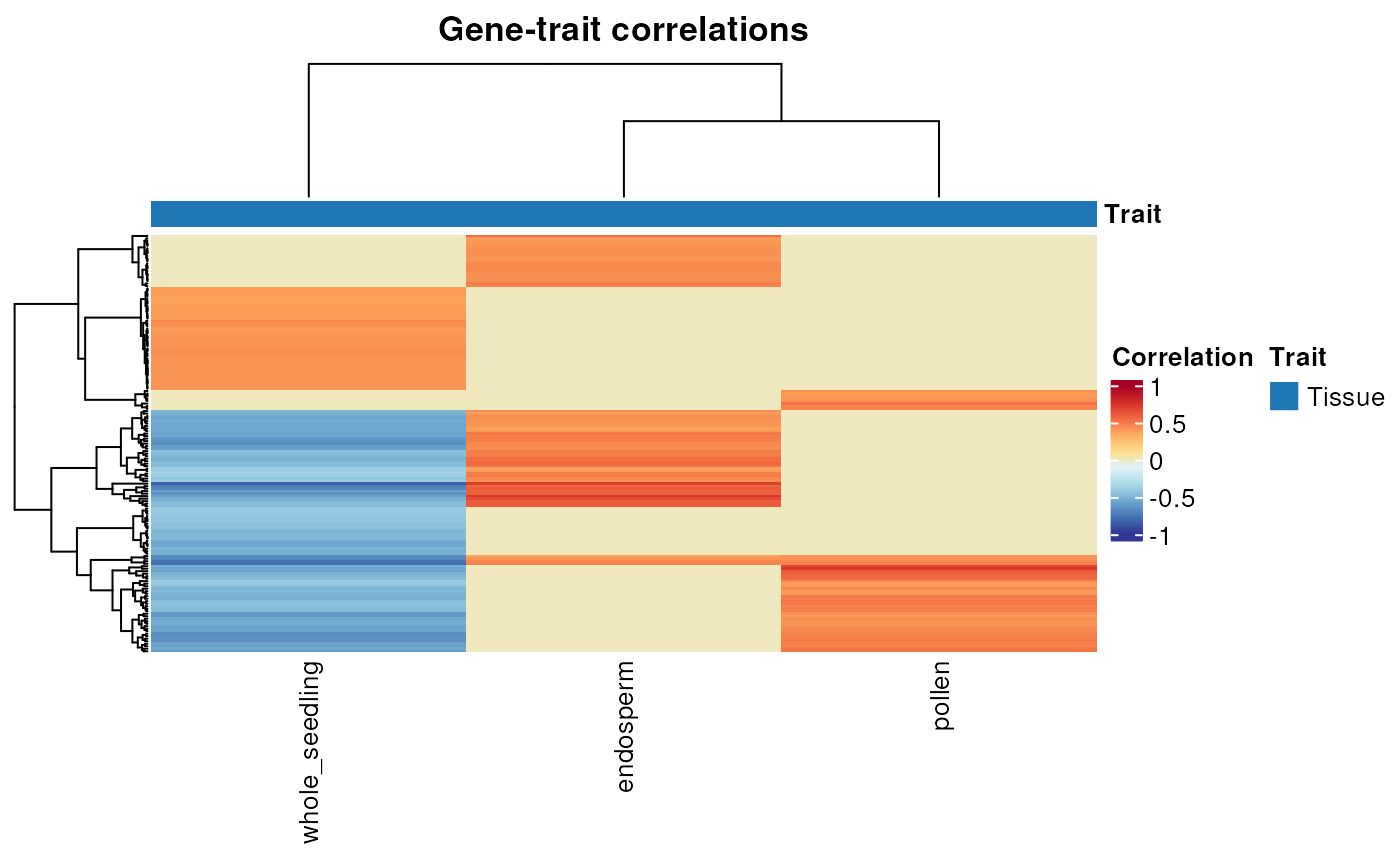
Plot a heatmap of gene significance
Arguments
- corandp
A data frame of gene-trait correlations as returned by
gene_significance().- palette
Character indicating which RColorBrewer palette to use. Default: 'RdYlBu'.
- transpose
Logical indicating whether to transpose the heatmap or not.
- ...
Additional arguments to
ComplexHeatmap::pheatmap().
Value
A `Heatmap` object created by ComplexHeatmap::pheatmap().
Details
Significance levels: 1 asterisk: significant at alpha = 0.05. 2 asterisks: significant at alpha = 0.01. 3 asterisks: significant at alpha = 0.001. no asterisk: not significant.
Examples
data(filt.se)
gcn <- exp2gcn(filt.se, SFTpower = 18, cor_method = "pearson")
#> ..connectivity..
#> ..matrix multiplication (system BLAS)..
#> ..normalization..
#> ..done.
corandp <- gene_significance(filt.se)
plot_gene_significance(corandp, show_rownames = FALSE)