Plot distribution of synonymous substitution rates (Ks)
Usage
plot_ks_distro(
  ks_df,
  min_ks = 0.01,
  max_ks = 2,
  bytype = FALSE,
  type_levels = NULL,
  plot_type = "histogram",
  binwidth = 0.03
)
Arguments
- ks_df
A data frame with Ks values for each gene pair as returned by
pairs2kaks().- min_ks
Numeric indicating the minimum Ks value to keep. Default: 0.01.
- max_ks
Numeric indicating the maximum Ks value to keep. Default: 2.
- bytype
Logical indicating whether or not to plot the distribution by type of duplication (requires a column named
type).- type_levels
(Only valid if bytype is not NULL) Character indicating which levels of the variable specified in parameter group_by should be kept. By default, all levels are kept.
- plot_type
Character indicating the type of plot to create. If bytype = TRUE, possible types are "histogram" or "violin". If bytype = FALSE, possible types are "histogram", "density", or "density_histogram". Default: "histogram".
- binwidth
(Only valid if plot_type = "histogram") Numeric indicating the bin width. Default: 0.03.
Examples
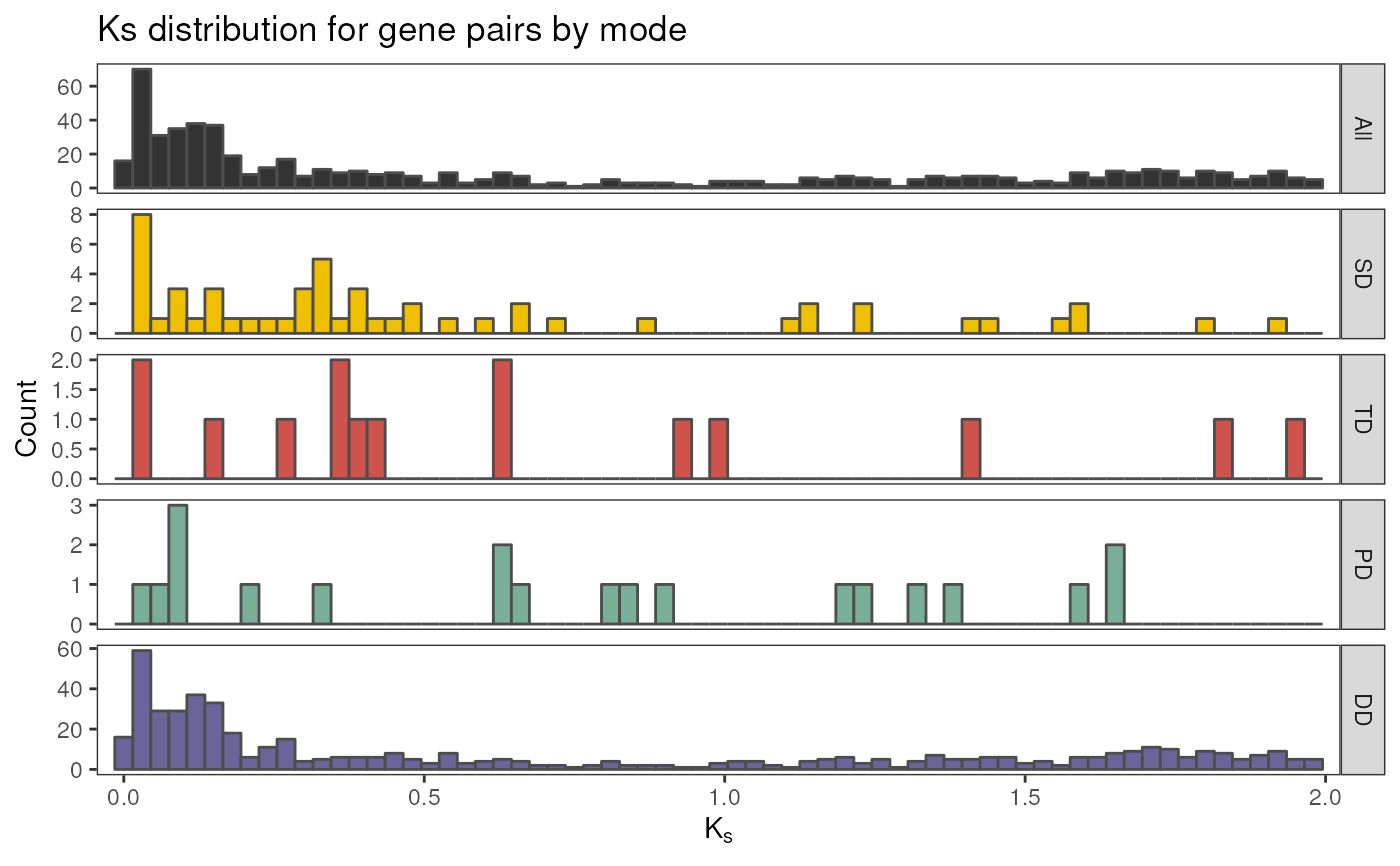
data(fungi_kaks)
ks_df <- fungi_kaks$saccharomyces_cerevisiae

# Plot distro
plot_ks_distro(ks_df, bytype = TRUE)