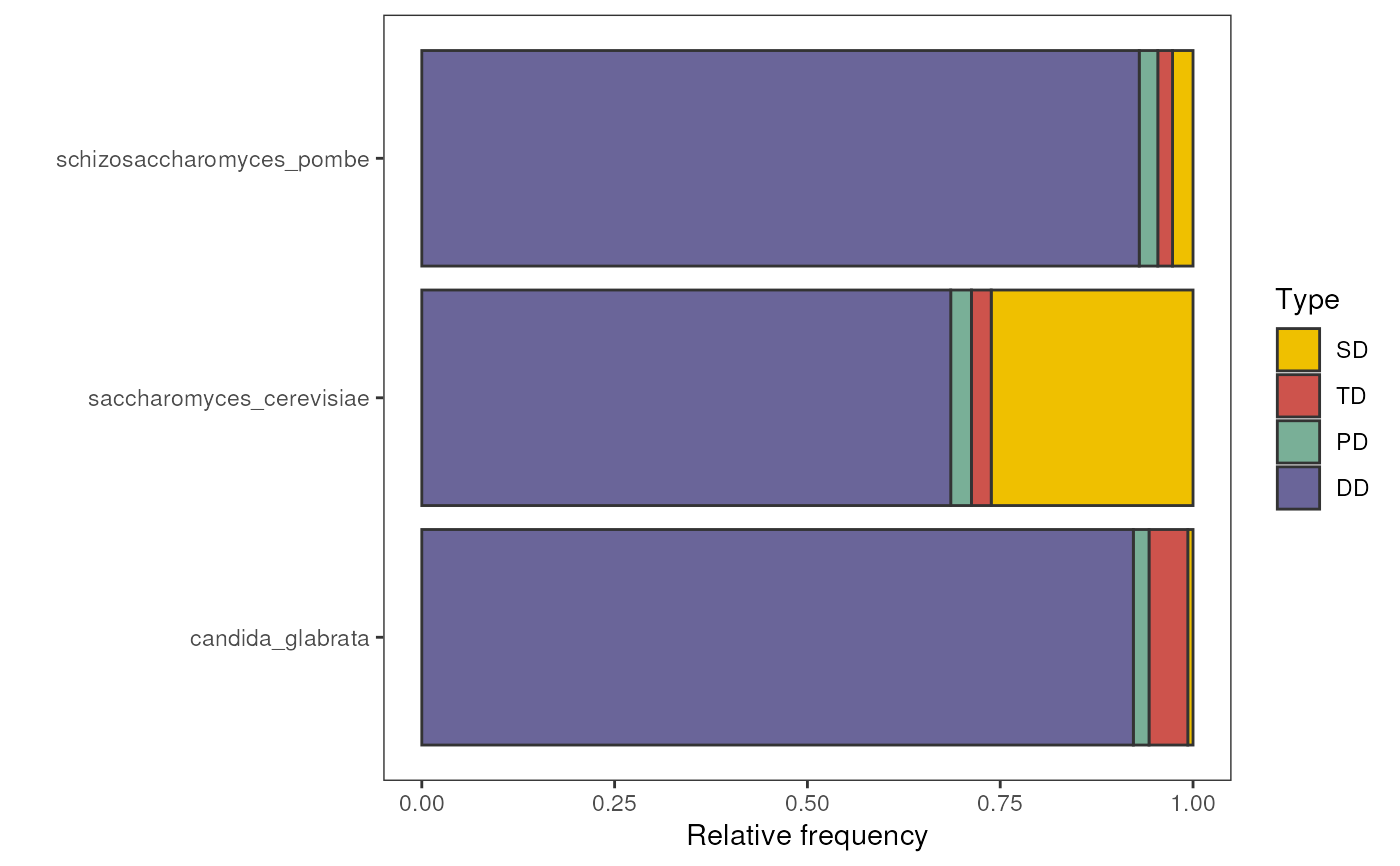
Plot frequency of duplicates per mode for each species
Source:R/visualization.R
plot_duplicate_freqs.RdPlot frequency of duplicates per mode for each species
Arguments
- dup_counts
A data frame in long format with the number of duplicates per mode for each species, as returned by the function
duplicates2counts.- plot_type
Character indicating how to plot frequencies. One of 'facet' (facets for each level of the variable type), 'stack' (levels of the variable type as stacked bars), or 'stack_percent' (levels of the variable type as stacked bars, with x-axis representing relative frequencies). Default: 'facet'.
- remove_zero
Logical indicating whether or not to remove rows with zero values. Default: TRUE.
Examples
data(fungi_kaks)

# Get unique duplicates
duplicate_list <- classify_genes(fungi_kaks)

# Get count table
dup_counts <- duplicates2counts(duplicate_list)

# Plot counts
plot_duplicate_freqs(dup_counts, plot_type = "stack_percent")