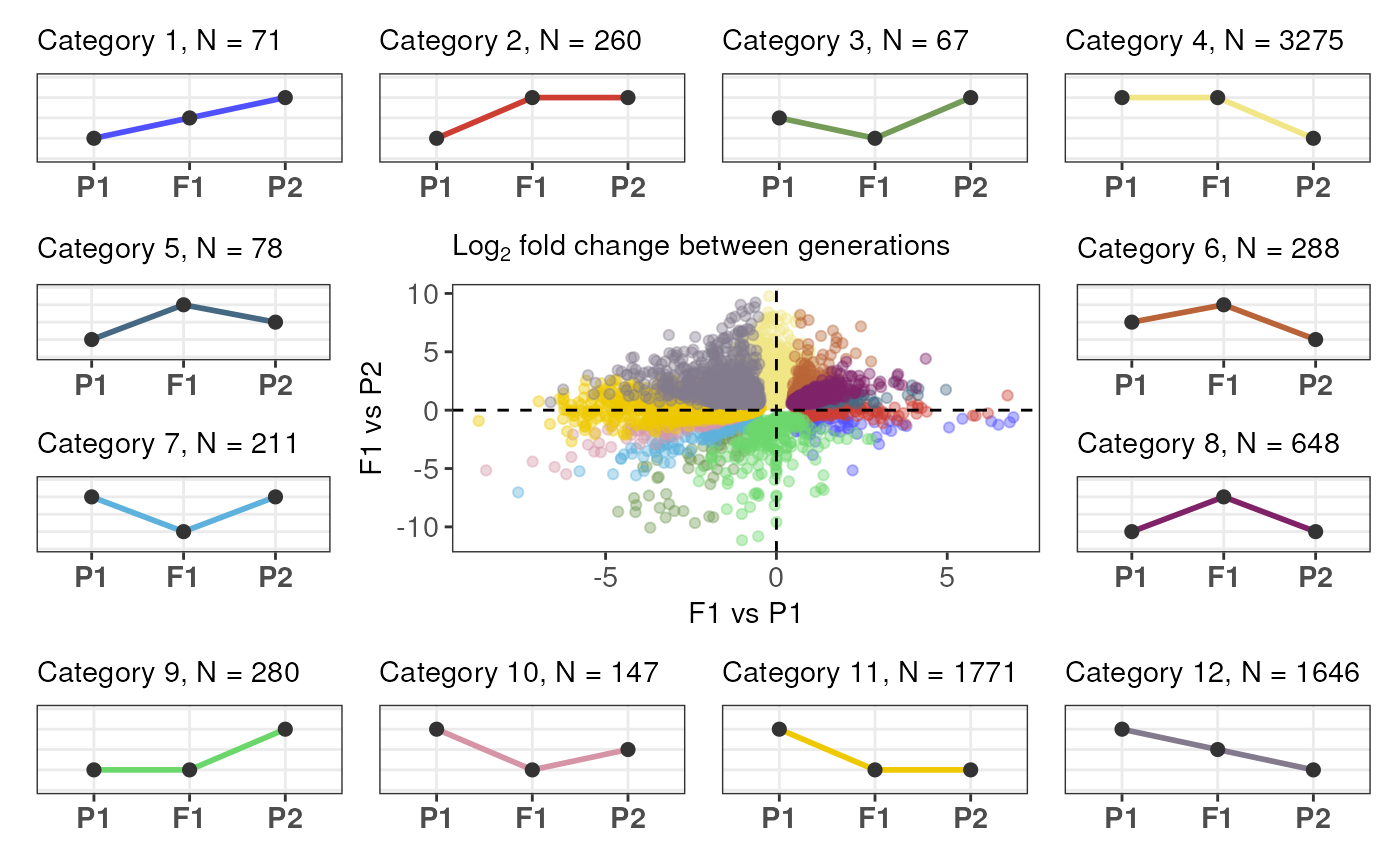
Plot expression partitions
Usage
plot_expression_partitions(
  partition_table,
  group_by = "Category",
  palette = NULL,
  labels = c("P1", "F1", "P2")
)
Arguments
- partition_table
A data frame with genes per expression partition as returned by
expression_partitioning().- group_by
Character indicating the name of the variable in partition_table to use to group genes. One of "Category" or "Class". Default: "Category".
- palette
Character vector with color names to be used for each level of the variable specified in group_by. If group_by = "Category", this must be a vector of length 12. If group_by = "Class", this must be a vector of length 5. If NULL, a default color palette will be used.
- labels
A character vector of length 3 indicating the labels to be given for parent 1, offspring, and parent 2. Default:
c("P1", "F1", "P2").
Examples
data(deg_list)
partition_table <- expression_partitioning(deg_list)
plot_expression_partitions(partition_table)