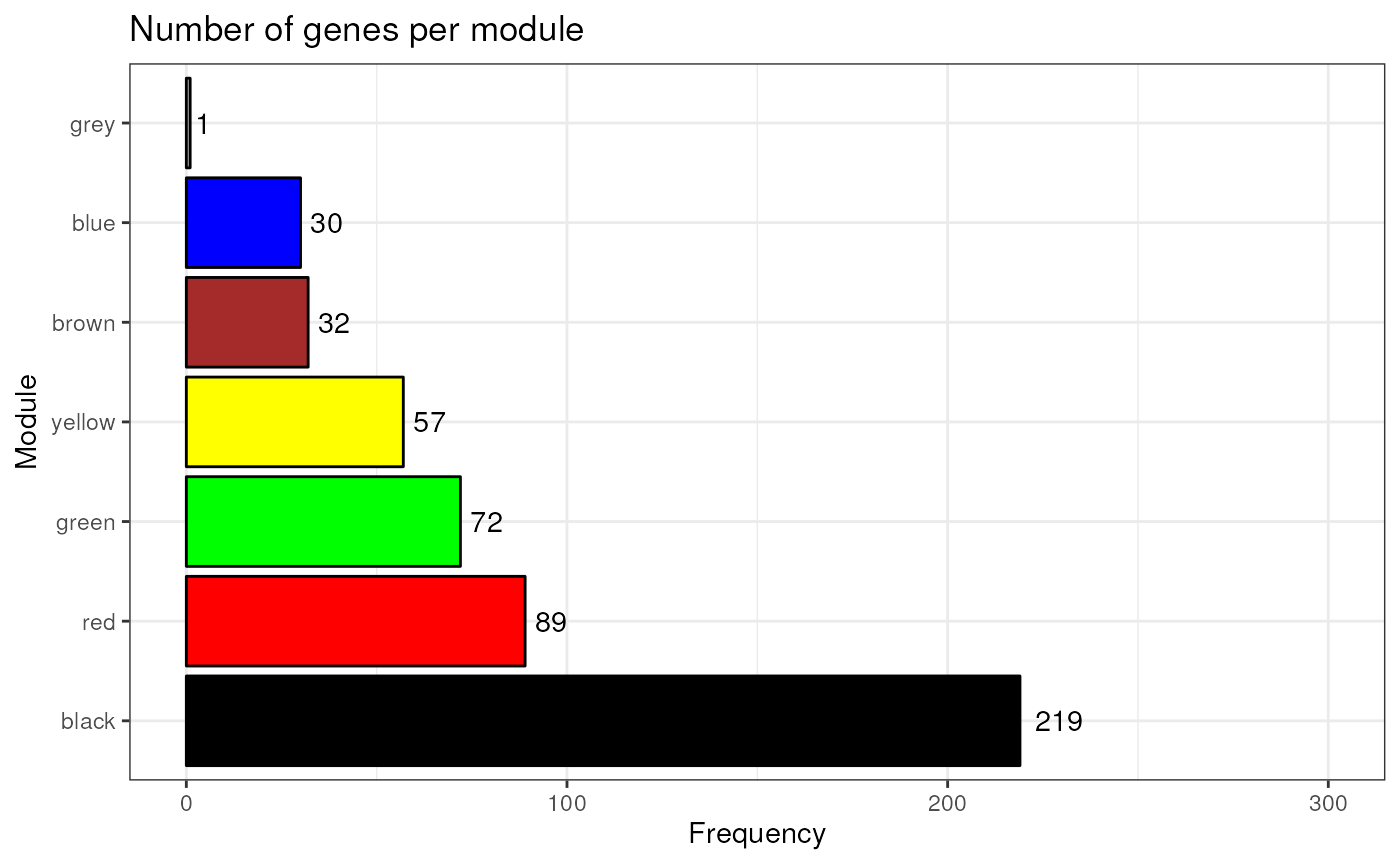
Plot number of genes per module
Usage
plot_ngenes_per_module(net = NULL)
Arguments
- net
List object returned by exp2gcn.
Value
A ggplot object with a bar plot of gene number in each module.
Examples
data(filt.se)
gcn <- exp2gcn(filt.se, SFTpower = 18, cor_method = "pearson")
#> ..connectivity..
#> ..matrix multiplication (system BLAS)..
#> ..normalization..
#> ..done.
plot_ngenes_per_module(gcn)