Plot expression profile of given genes across samples
Source:R/exploratory_analysis.R
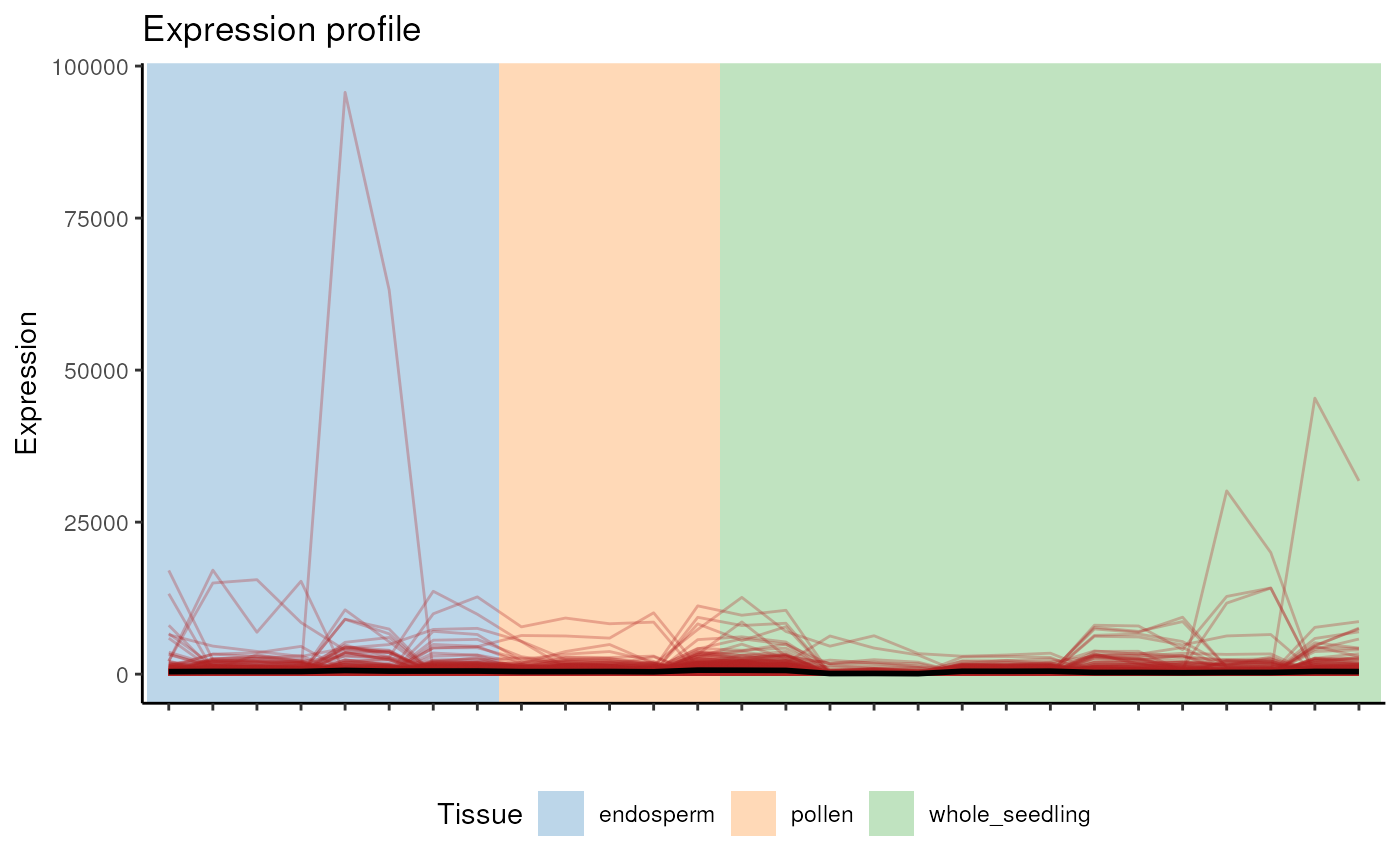
plot_expression_profile.RdPlot expression profile of given genes across samples
Usage
plot_expression_profile(
  genes,
  exp,
  metadata,
  metadata_cols = 1,
  plot_module = TRUE,
  net,
  modulename,
  bg_line = "mean"
)
Arguments
- genes
Character vector containing a subset of genes from which edges will be extracted. It can be ignored if
plot_moduleis TRUE.- exp
A gene expression data frame with genes in row names and samples in column names or a `SummarizedExperiment` object.
- metadata
A data frame of sample metadata containing sample names in row names and sample annotation in subsequent columns. Ignored if `exp` is a `SummarizedExperiment` object, since colData will be automatically extracted.
- metadata_cols
A character or numeric scalar indicating which column should be extracted from column metadata if exp is a `SummarizedExperiment` object. The column to be extracted can be represented by indices (numeric) or column names (character). By default, the first column is used.
- plot_module
Logical indicating whether to plot a whole module or not. If set to FALSE,
genesmust be specified.- net
List object returned by
exp2gcn.- modulename
Name of the module to plot.
- bg_line
Character indicating what to show in the background (black) line. One of "mean" or "median". Default: "mean".