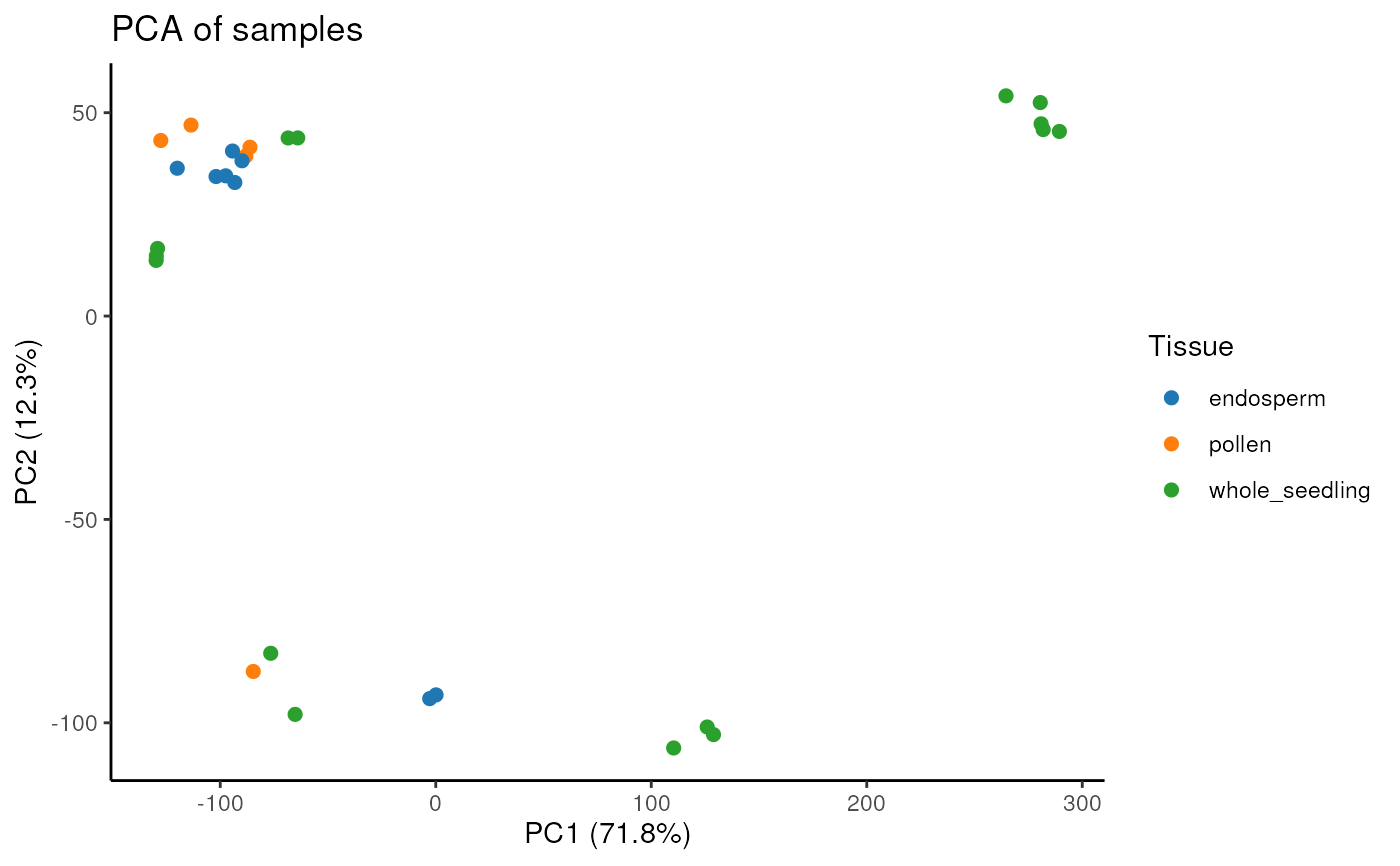
Plot Principal Component Analysis (PCA) of samples
Usage
plot_PCA(
  exp,
  metadata,
  metadata_cols = NULL,
  log_trans = FALSE,
  PCs = c(1, 2),
  size = 2
)
Arguments
- exp
A gene expression data frame with genes in row names and samples in column names or a `SummarizedExperiment` object.
- metadata
A data frame of sample metadata containing sample names in row names and sample annotation in subsequent columns. Ignored if `exp` is a `SummarizedExperiment` object, since colData will be automatically extracted.
- metadata_cols
A vector (either numeric or character) indicating which columns should be extracted from column metadata if exp is a `SummarizedExperiment` object. The vector can contain column indices (numeric) or column names (character). By default, all columns are used.
- log_trans
Logical indicating whether the gene expression matrix should be log transformed using
log(exp + 1). Default: FALSE.- PCs
Numeric vector of length 2 indicating the principal components to be plotted on the x-axis and y-axis, respectively. Default:
c(1, 2).- size
Numeric indicating the point size. Default is 2.
Examples
data(zma.se)
plot_PCA(zma.se, log_trans = TRUE)