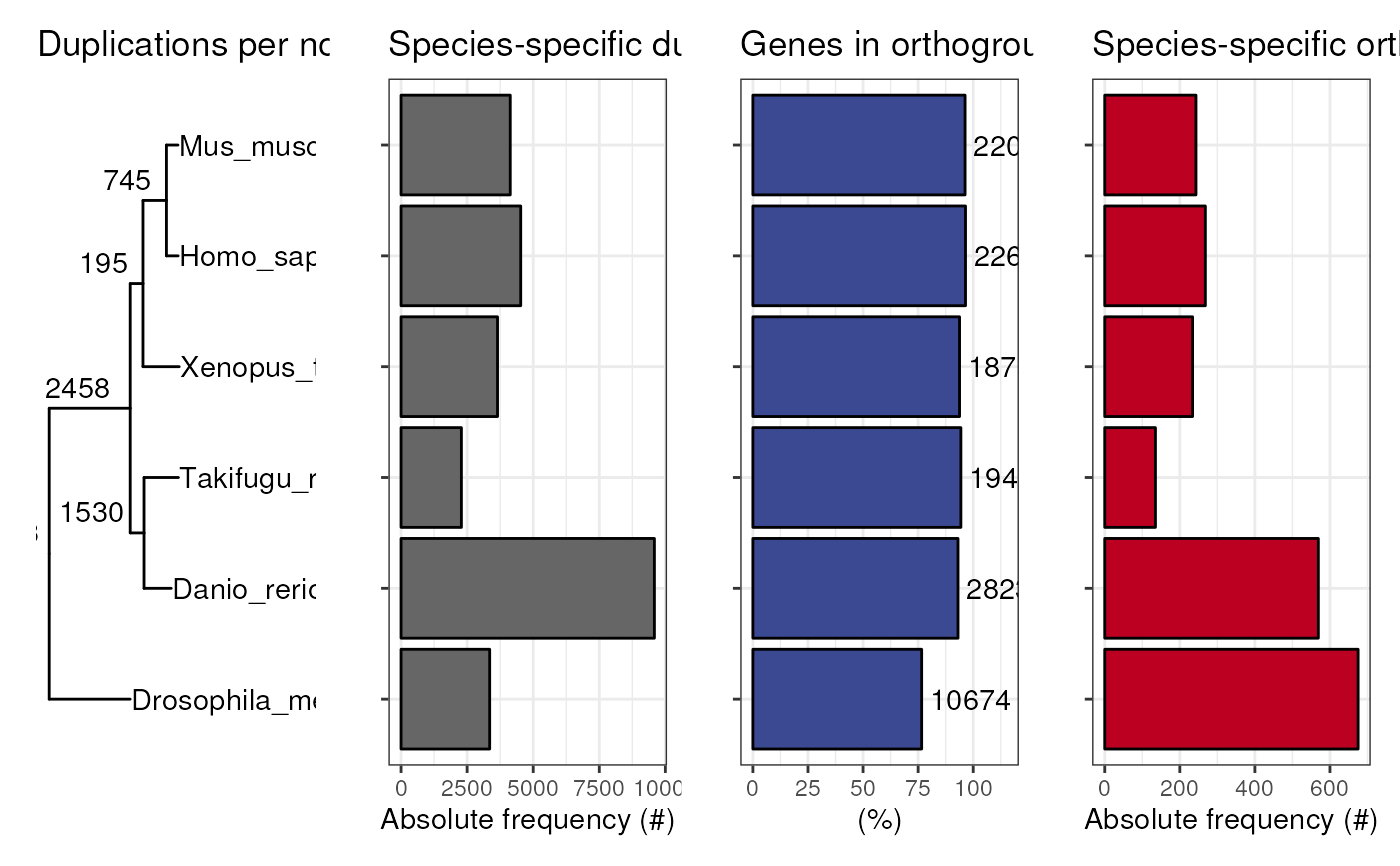
Plot a panel with a summary of Orthofinder stats
Source:R/visualization.R
plot_orthofinder_stats.RdThis function is a wrapper for plot_species_tree,
plot_duplications, plot_genes_in_ogs,
plot_species_specific_ogs.
Usage
plot_orthofinder_stats(tree = NULL, stats_list = NULL, xlim = c(0, 1))Arguments
- tree
Tree object as returned by
treeio::read.*, a family of functions in the treeio package to import tree files in multiple formats, such as Newick, Phylip, NEXUS, and others. If your species tree was inferred with Orthofinder (using STAG), the tree file is located in Species_Tree/SpeciesTree_rooted_node_labels.txt. Then, it can be imported withtreeio::read_tree(path_to_file).- stats_list
(optional) A list of data frames with Orthofinder summary stats as returned by the function
read_orthofinder_stats. If this list is given as input, nodes will be labeled with the number of duplications.- xlim
Numeric vector of x-axis limits. This is useful if your node tip labels are not visible due to margin issues. Default: c(0, 1).
Examples
data(tree)
dir <- system.file("extdata", package = "cogeqc")
stats_list <- read_orthofinder_stats(dir)
plot_orthofinder_stats(tree, xlim = c(0, 1.5), stats_list = stats_list)
#> ! # Invaild edge matrix for <phylo>. A <tbl_df> is returned.
#> ! # Invaild edge matrix for <phylo>. A <tbl_df> is returned.
