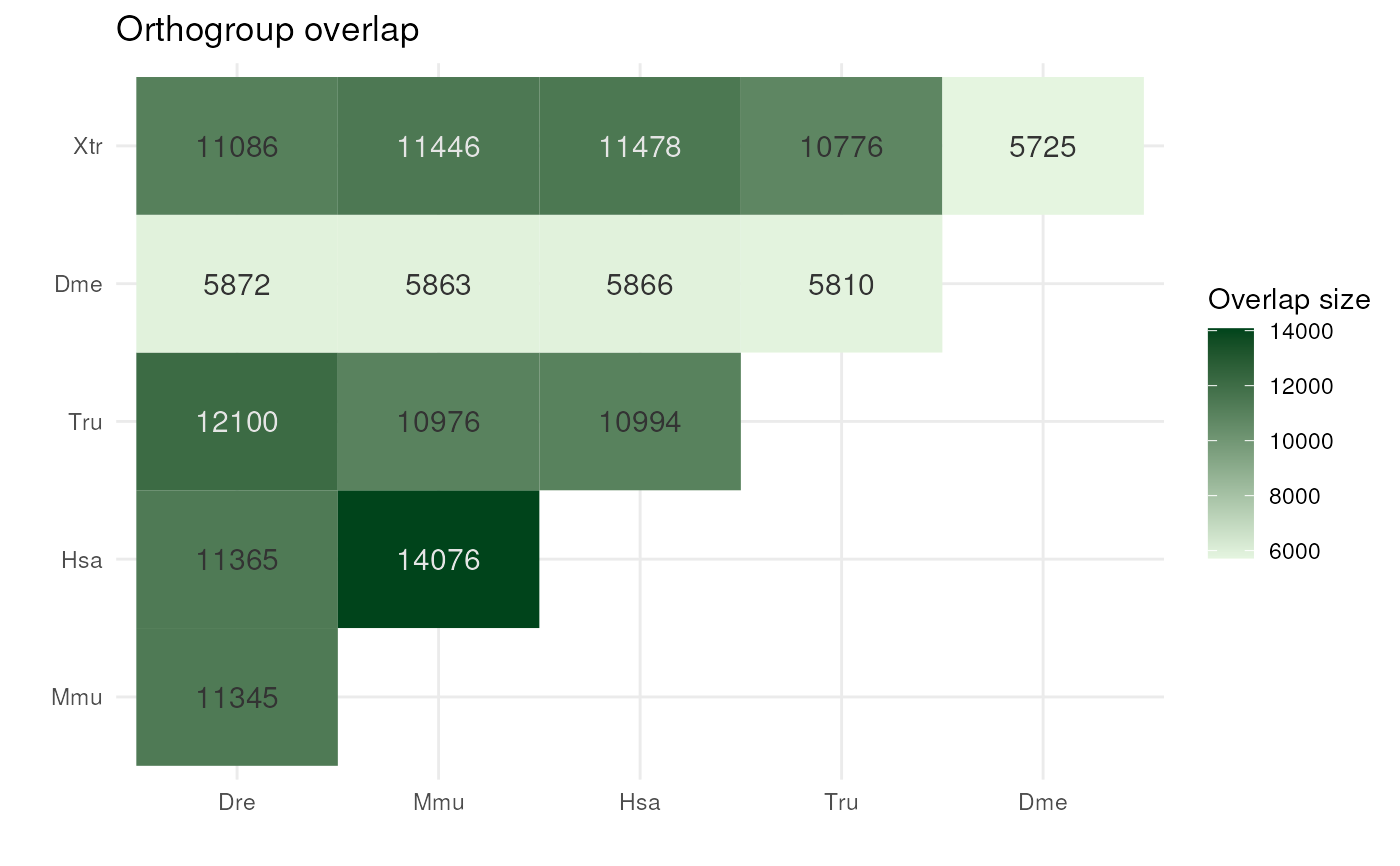
Plot pairwise orthogroup overlap between species
Arguments
- overlap_df
A data frame with the number of shared orthogroups between species pairs as returned by
get_og_overlap().- add_numbers
Logical indicating whether to add numbers to each entry of the heatmap. Default: FALSE.
- abbreviate_names
Logical indicating whether to abbreviate species names. Default: TRUE.
Value
A ggplot object with a heatmap displaying the number of shared orthogroups between species pairs.
Examples
data(og_overlap_model)
plot_og_overlap(og_overlap_model, add_numbers = TRUE)