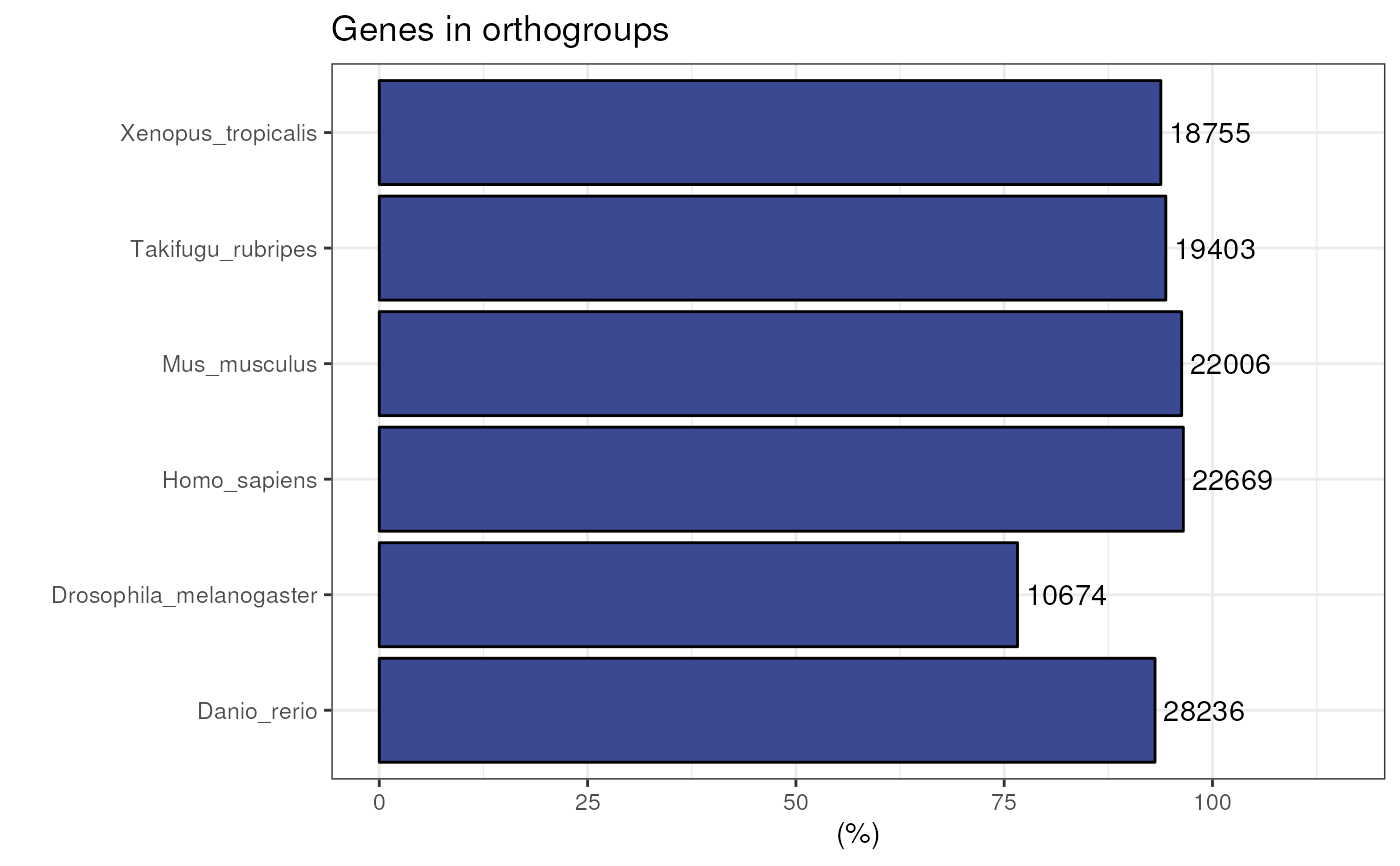
Plot percentage of genes in orthogroups for each species
Source:R/visualization.R
plot_genes_in_ogs.RdPlot percentage of genes in orthogroups for each species
Examples
dir <- system.file("extdata", package = "cogeqc")
stats_list <- read_orthofinder_stats(dir)
plot_genes_in_ogs(stats_list)