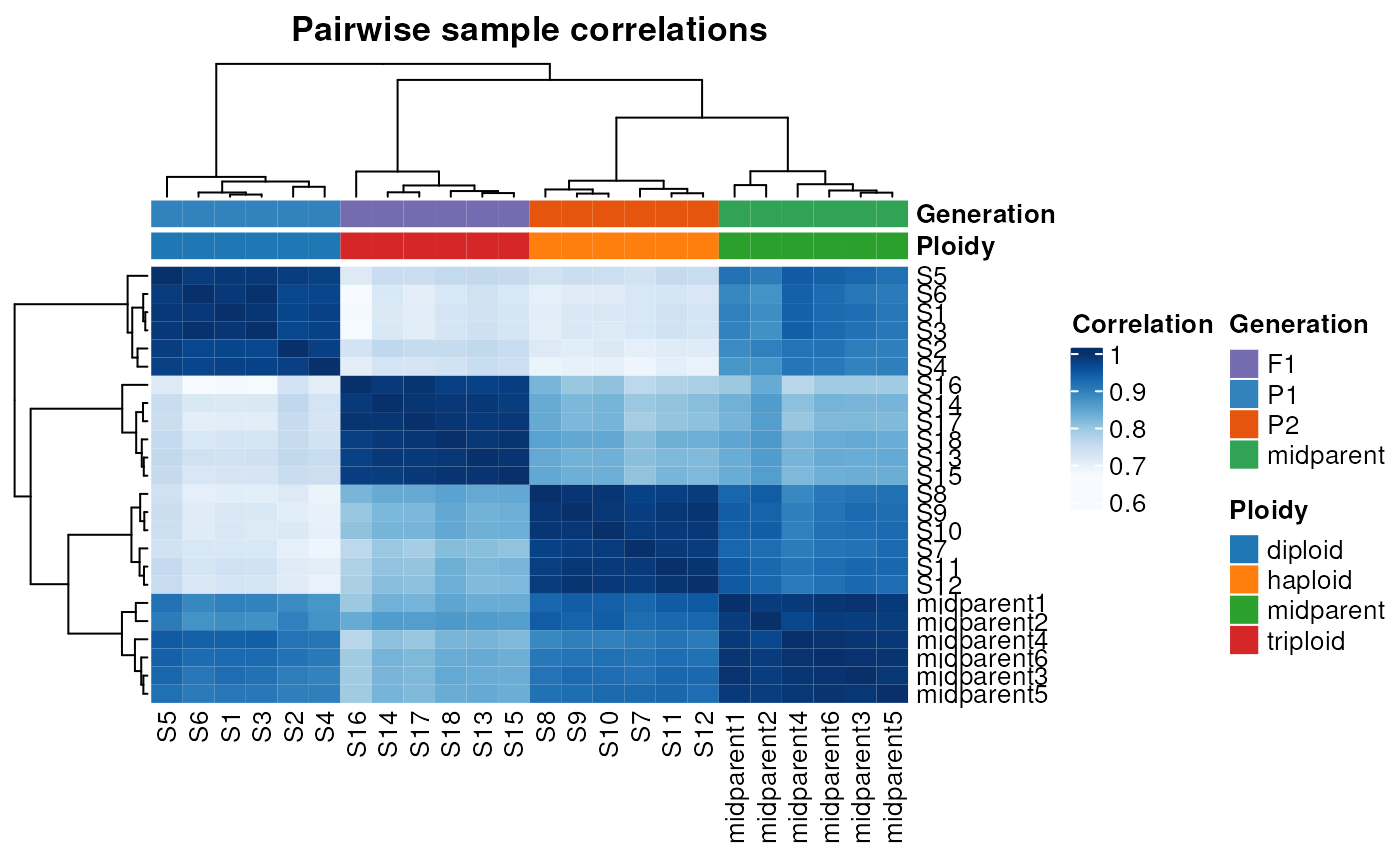
Plot a heatmap of pairwise sample correlations with hierarchical clustering
Source:R/visualization.R
plot_samplecor.RdPlot a heatmap of pairwise sample correlations with hierarchical clustering
Usage
plot_samplecor(
  se,
  coldata_cols = NULL,
  rowdata_cols = NULL,
  ntop = 500,
  cor_method = "pearson",
  palette = "Blues",
  ...
)
Arguments
- se
A
SummarizedExperimentobject with a count matrix and sample metadata in the colData slot. If a rowData slot is available, it can also be used for clustering rows.- coldata_cols
A vector (either numeric or character) indicating which columns should be extracted from colData(se).
- rowdata_cols
A vector (either numeric or character) indicating which columns should be extracted from rowData(se).
- ntop
Numeric indicating the number of top genes with the highest variances to use for the PCA. Default: 500.
- cor_method
Character indicating the correlation method to use. One of "pearson" or "spearman". Default: "pearson".
- palette
Character indicating the name of the color palette from the RColorBrewer package to use. Default: "Blues".
- ...
Additional arguments to be passed to
ComplexHeatmap::pheatmap(). These arguments can be used to control heatmap aesthetics, such as show/hide row and column names, change font size, activate/deactivate hierarchical clustering, etc. For a complete list of the options, see?ComplexHeatmap::pheatmap().
Examples
data(se_chlamy)
se <- add_midparent_expression(se_chlamy)
se$Ploidy[is.na(se$Ploidy)] <- "midparent"
se$Generation[is.na(se$Generation)] <- "midparent"
plot_samplecor(se, ntop = 500)
#> converting counts to integer mode