Plot a triangle of comparisons of DEG sets among generations
Source:R/visualization.R
plot_expression_triangle.RdPlot a triangle of comparisons of DEG sets among generations
Arguments
- deg_counts
Data frame with number of differentially expressed genes per contrast as returned by
get_deg_counts.- palette
Character vector of length 4 indicating the colors of the boxes for P1, P2, F1, and midparent, respectively. If NULL, a default color palette will be used.
- box_labels
Character vector of length 4 indicating the labels of the boxes for P1, P2, F1, and midparent, respectively. Default: NULL, which will lead to labels "P1", "P2", "F1", and "Midparent", respectively.
Details
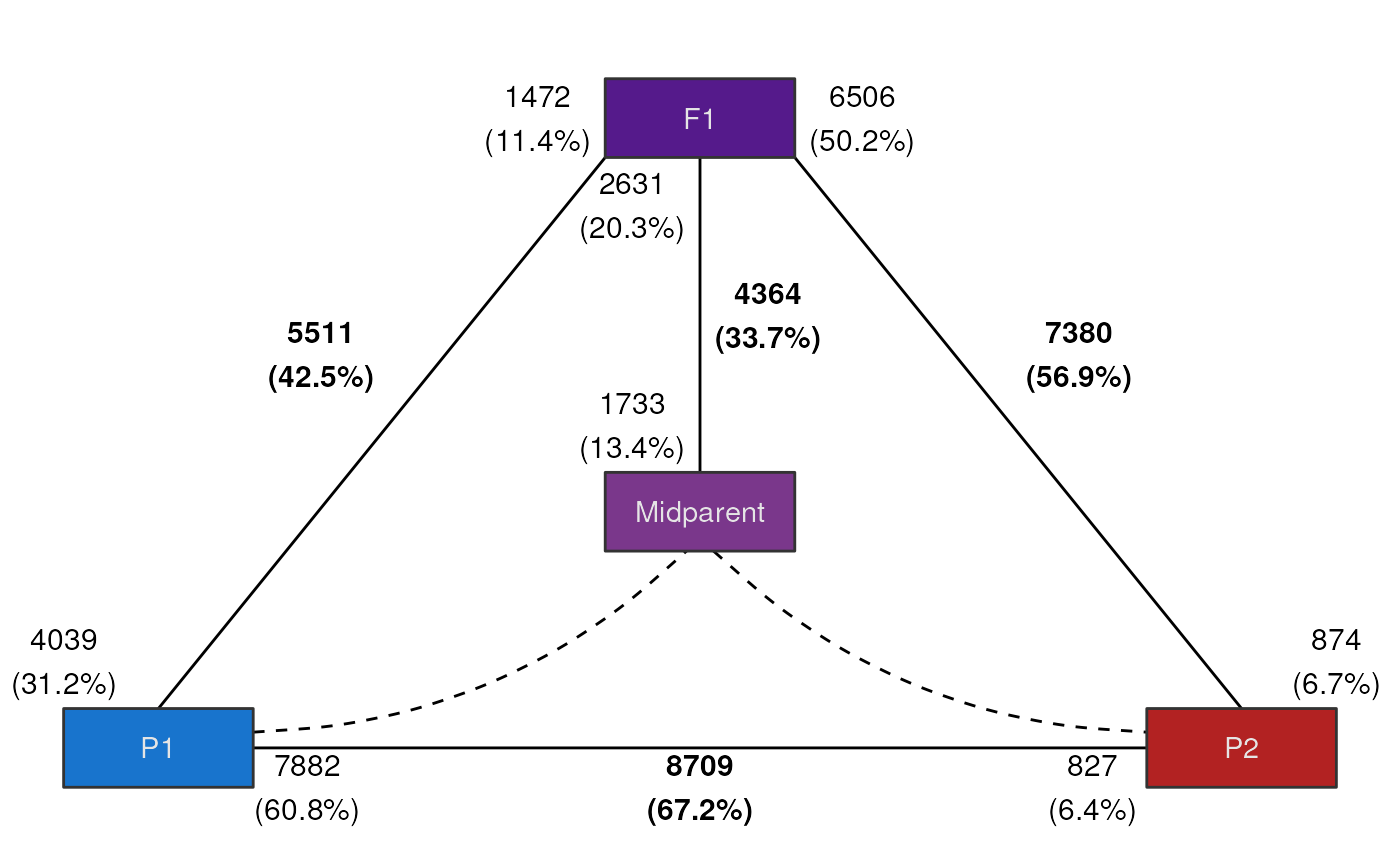
The expression triangle plot shows the number of differentially expressed genes (DEGs) for each contrast. Numbers in the center of the lines (in bold) indicate the total number of DEGs, while numbers near boxes indicate the number of up-regulated genes in each generation of the triangle.
Examples
data(deg_counts)
plot_expression_triangle(deg_counts)